
If you are looking for a post that lists out all available rubber fender design types like “pneumatic fender”, “modular fender”, “D-shaped bumper” etc, you should visit “Rubber Fenders: Types & Things to Note” article.

This article post aim to discuss the generally used equations, formulas, factors to determine a suitable port fender design. All formulas and equations are only intended as reference only. If you have a project, drop us an email so our technical staff can advise you.
Contributed by Wang.

A solution to absorb collision & prevent damage
Since the early days of floating crafts & small wooden boats, fenders were woven from ropes to absorb collision during berthings. Similar to the products we have today, they came in various sizes and patterns to serve different needs. The primary function of such a “soft-contact” system is to prevent the vessel from sustaining damage as the ship or boat is being moored against the quay wall. However, the vast amount of variations may confuse some looking to purchase certain fenders for their new-built port or jetty. In short, impact forces during the vessel berth, abrasive action, among other factors must be taken into consideration as well as the block safety coefficient to provide some allowance. The multi dimensional forces may cause extensive damage to the jetty structure AND the ship at the same time if a less suitable fender is used (or worse, a low performance fender system is deployed). So, it is about absorbing contact and distributing the force onto a larger surface area to prevent damage. Aside from mostly uniformly distributing collision force, it also increases impact time to lower the reaction force in whole.
Yes, it is important to have a structure of this kind to prevent damage to the quay wall or jetty or harbour.
Quite simply, determining a suitable marine fender system comes down to considering:
Amount of Energy Absorbed and Maximum Impact Force Imparted
Common Selection Process: All Conditions must be Carefully Studied
It is important to keep in mind that the local marine condition is as big a factor as the ships the quay is accomodating. Both aspects affect the choice of “marine bumpers” used. So it is not surprising to see two different types of fender systems being deployed in the same city, but to accommodate different types of ships. Harbor conditions are also rarely the same. Successful previous local experience must be considered. The best way to figure out what type of port fender is suitable for your berthing structure would be to carefully study your own local marine condition that includes:
- Site condition and depth
- Local temperature range & weather
- Wind velocity
- Direction of ship when berthing
- Tidal range & wave height
- Berthing structure
- Type of ships, along with class, configuration, size
- Velocity of ship approaching the quay wall during berthing
- Exposure of harbor basins
- Available docking assistance
- Are there any specific codes and standards that you need to conform to?
- Intended useful life of product? Some fenders are longer lasting than others.
- Safety factor?
- Designated vessels for berthing calculations?
- Velocity range?
- Costs: From installation fees, to maintenance costs. All has to be thoroughly considered.
Guide:
The law of energy conversation is the basis for all fender design selection. When choosing fenders, it is vital to base calculations and considerations on the largest (heaviest) vessel sizes to be berthed at the wharf. Besides, vessels are getting larger as ship design evolves from time to time. It is important to take into consideration those expected to arrive in the near foreseeable future.
Fender Energy Absorption = Energy Delivered upon impact – Energy absorbed by pier
To understand how much energy absorption is needed, one needs to first determine the energy that will be delivered to the quay wall upon initial impact.
Secondly, one has to then carry out calculation to find out the energy that requires to be absorbed. For linearly elastic structures, the energy is ½ the maximum static load level times amount of deflection. Some allowance should be added. If the structure is very rigid, one can assume no energy absorption from the pier.
Minus the energy amount absorbed by pier and one can determine the fender energy absorption value that is required for a safe berth.
Then, one can choose a suitable fender type and design from a wide range of available marine fenders in the market today: from super cone type, arch type, cylindrical shaped, to floating types like Yokohama fenders and foam fenders. Be sure to select a manufacturer that adheres to PIANC2002 and/or other standards to ensure great quality fender products.
| GT | Gross Tonnage | Total volume of cargo + vessel |
| NT | Net Tonnage | Total volume of cargo on vessel |
| DPT | Displacement Tonnage | Total weight of the cargo-filled vessel when vessel is loaded to the draft line |
| DWT | DeadWeight Tonnage | Weight of cargo + people (including crew) + fuel + food on the vessel |
| LOW | Light Weight | Vessel weight |
| BW | Ballast Weight | Weight of the vessel when water is added in the ballast |
Types of Berthing Approach:
Side Berthing:

‘Dolphin’ Berthing:

End Berthing:

Lock Entrances:

Ship-to-ship (STS) Approach:

This article only discusses berthing calculations for side berthing. If you have a Ship-to-ship (STS) operation or End Berthing, certain equations may be different. Contact our team for assistance.
Effective Berthing Energy formula for Side Berthing:


This is the most common berthing method for docks. The berthing energy is calculated with the equation:
EB = Berthing energy (kJ, N*m, or lbF*ft)
EB = 0.5 × WD × VB × VB × CM × CE × CC × CS
*click to open/close
WD = Water displacement of the vessel (kg, tons, lbs). This is the Total Displacement Tonnage(DPT) of the vessel.
VB = Berthing velocity of the vessel at the moment of impact (m/sec, ft/sec). Berthing velocity is an important parameter in fender system design. It depends on the size of the vessel, loading condition, port structure, and the difficulty of the approach. The most appropriate method to determine berthing velocity is based on actual previous statistical data. If that is not possible, the most widely used reference would be the Brolsma table, adopted by BSI, PIANC and other standards. However, it is important to keep in mind that the best option is still to base on previous statistical information.

CM = Mass Coefficient/Virtual mass factor: During the sudden stop of movement as a vessel comes into contact with the berth, the mass of water moving with the vessel adds to the energy acting upon the vessel and fender. This situation is referred to as “Added Mass Coefficient” or “Mass Factor”. Weight of water moving that adds to that is called “ Additional Weight” in these berthing studies.
As the vessel is stopped by the fenders, the momentum of the water continues to push against the vessel and this actually increases its overall mass, so CM has to be calculated. There are 2 ways to calculate its mass coefficient.
The most commonly used “Vasco Costa (1964) method”:

Formula B:


You require these info:
- Distance between center of mass (vessel’s) to the point of impact (R)
- Velocity vector angle (v)
- Radius of gyration (K)
- Berthing angle(α)
NOTE:
K: Radius of vessel rotation (usually 1/4 of the vessel’s length)
R: Distance of the line paralleled to wharf from the vessel’s Center of Gravity (CG) to the contact point. Common cases are 1/4 to 1/5 of vessel’s length.
CB: Block Coefficient, which is related to the hull shape.
WD: Water displacement of the berthing ship(kg, Tons, lbs)
![]() : Sea Water density(1.025 Tons/m3)
: Sea Water density(1.025 Tons/m3)
LBP: Length between perpendiculars. Please see sketch below for better explanation:
x: Distance from bow to point of impact
B: Beam(m, ft)
Formula (i): The more detailed calculation to find out C E :

If the beam, length and draft information are not available, this table can be used to estimate:
| Typical Block Coefficients(CB) | ||
| Type of Vessel | CB BS 6349 |
CB PIANC 2002 |
| Tankers | 0.72~0.85 | 0.85 |
| Bullk Carriers | 0.72~0.85 | 0.72~0.85 |
| Container Ships | 0.65~0.75 | 0.60~0.80 |
| General Cargo | 0.60~0.75 | 0.72~0.85 |
| RoRo Vessels | 0.65~0.70 | 0.70~0.80 |
| Ferries | 0.50~0.65 | 0.55~0.65 |
Formula (ii): The more simple formula to find out C E :

This method can lead to a serious underestimation of Berthing Energy when the berthing angle (α) is greater than 10° and/or the point of impact is aft of quarter-point(x > LBP/4).
To verify your calculations, one can check the calculated C E values to ensure they generally fall within the following limits:
| Quarter-Point Berthing | x = L/4 | Ce = 0.5 |
| Third-Point Berthing | x = L/3 | Ce = 0.6 ~ 0.8 |
| Mid-Vessel Berthing | x = L/2 | Ce = 1 |
Closed Dock case
A closed Dock would be a wharf, where you have a concrete wall going directly to the sea ground. In this case the quay wall will push back all the water that is being moved by the vessel. This creates a resistance factor that can be calculated as follows:
If KC ≤ D / 2, CC ≈ 0.8
If KC > D / 2, CC ≈ 0.9
Open / Semi-Closed Dock case
A semi-closed dock is when water can flow underneath the dock, but the depth changes below the dock. Open dock is usually a dock with piles underneath and the water can flow freely underneath the dock. In such case we can assume the following value of 1.
CC ≈ 1
When selecting the size of fenders, it should be selected base on the consideration of kinetic energy of contact between two vessels or between vessel and berthing facilities may be absorbed by a single fender. The following tables are given for determining the energy absorption depends on approaching velocities for various ships.
Energy absorption for ship-to-Jetty (for reference only)
*click to open/close
Table (i) Energy Absorption of Oil Tankers at ¼ point Berthing (kJ)
| DWT | Assumed
Weight(t) |
Approaching velocity (m/s) | |||||||
| 0.10 | 0.12 | 0.15 | 0.18 | 0.20 | 0.25 | 0.30 | 0.40 | ||
| 300 | 668 | 1.7 | 2.5 | 3.8 | 5.5 | 6.8 | 11.0 | 15.0 | 27.0 |
| 500 | 1,091 | 2.8 | 4.0 | 6.3 | 9.0 | 11.0 | 17.0 | 25.0 | 45.0 |
| 700 | 1,558 | 4.0 | 5.7 | 8.9 | 13.0 | 16.0 | 25.0 | 36.0 | 64.0 |
| 1,000 | 2,228 | 5.7 | 8.2 | 14.0 | 18.0 | 23.0 | 36.0 | 51.0 | 91.0 |
| 2,000 | 4,294 | 11.0 | 16.0 | 28.0 | 35.0 | 44.0 | 68.0 | 99.0 | 175 |
| 3,000 | 6,470 | 17.0 | 24.0 | 37.0 | 53.0 | 66.0 | 103 | 149 | 264 |
| 4,000 | 8,363 | 21.0 | 31.0 | 54.0 | 69.0 | 85.0 | 133 | 192 | 341 |
| 5,000 | 10,594 | 27.0 | 39.0 | 61.0 | 88.0 | 108 | 169 | 243 | 432 |
| 6,000 | 12,184 | 31.0 | 45.0 | 70.0 | 101 | 124 | 194 | 280 | 497 |
| 7,000 | 14,084 | 36.0 | 52.0 | 81.0 | 116 | 144 | 225 | 323 | 575 |
| 8,000 | 16,066 | 41.0 | 59.0 | 92.0 | 133 | 164 | 256 | 369 | 656 |
| 10,000 | 20,373 | 52.0 | 75.0 | 117 | 168 | 208 | 325 | 468 | 832 |
| 12,000 | 23,851 | 61.0 | 88.0 | 137 | 197 | 243 | 380 | 548 | 974 |
| 15,000 | 29,493 | 75.0 | 108 | 169 | 244 | 301 | 470 | 677 | 1200 |
| 17,000 | 33,056 | 84.0 | 121 | 190 | 273 | 337 | 527 | 759 | 1350 |
| 20,000 | 38,623 | 99.0 | 142 | 222 | 319 | 394 | 616 | 887 | 1580 |
| 25,000 | 45,946 | 117.0 | 169 | 264 | 380 | 469 | 733 | 1050 | 1880 |
| 30,000 | 56,093 | 143.0 | 206 | 322 | 464 | 572 | 894 | 1290 | 2290 |
| 35,000 | 63,084 | 161.0 | 232 | 362 | 521 | 644 | 1010 | 1450 | 2570 |
| 40,000 | 72,771 | 186.0 | 267 | 418 | 601 | 743 | 1160 | 1670 | 2970 |
| 45,000 | 77,986 | 199.0 | 286 | 448 | 645 | 796 | 1240 | 1790 | 3180 |
| 50,000 | 89,818 | 229.0 | 330 | 516 | 742 | 917 | 1430 | 2060 | 3670 |
| 60,000 | 104,300 | 266.0 | 383 | 599 | 862 | 1060 | 1660 | 2390 | 4260 |
| 65,000 | 114,637 | 292.0 | 421 | 658 | 948 | 1170 | 1830 | 2630 | 4680 |
| 70,000 | 122,108 | 312.0 | 449 | 701 | 1010 | 1250 | 1950 | 2800 | 4980 |
| 80,000 | 136,972 | 349.0 | 503 | 786 | 1130 | 1400 | 2180 | 3140 | 5590 |
| 85,000 | 143,359 | 366.0 | 527 | 823 | 1180 | 1460 | 2290 | 3290 | 5850 |
| 100,000 | 166,004 | 423.0 | 610 | 953 | 1370 | 1690 | 2650 | 3810 | 6780 |
| 120,000 | 200,083 | 510.0 | 735 | 1150 | 1650 | 2040 | 3190 | 4590 | 8170 |
| 150,000 | 251,896 | 643.0 | 925 | 1450 | 2080 | 2570 | 4020 | 5780 | 10280 |
| 200,000 | 327,735 | 836.0 | 1200 | 1880 | 2710 | 3340 | 5230 | 7520 | 13380 |
| 250,000 | 401,268 | 1020 | 1470 | 2300 | 3320 | 4090 | 6400 | 9210 | 16380 |
| 330,000 | 548,670 | 1400 | 2020 | 3150 | 4530 | 5600 | 8750 | 12600 | 22390 |
| 370,000 | 627,016 | 1600 | 2300 | 3600 | 5180 | 6400 | 10000 | 14400 | 25590 |
| 480,000 | 795,540 | 2030 | 2920 | 4570 | 6580 | 8120 | 12680 | 18260 | 32470 |
Table (ii) Energy Absorption of Ore Carriers at ¼ point Berthing (kJ)
| DWT | Assumed
Weight(t) |
Approaching velocity (m/s) | |||||||
| 0.10 | 0.12 | 0.15 | 0.18 | 0.20 | 0.25 | 0.30 | 0.40 | ||
| 1,000 | 2,360 | 6.0 | 8.7 | 14.0 | 20.0 | 24.0 | 38.0 | 54.0 | 96.0 |
| 2,000 | 4,429 | 11.0 | 16.0 | 25.0 | 37.0 | 45.0 | 71.0 | 102 | 181 |
| 3,000 | 6,453 | 16.0 | 24.0 | 37.0 | 53.0 | 66.0 | 103 | 148 | 263 |
| 4,000 | 8,341 | 21.0 | 31.0 | 48.0 | 69.0 | 85.0 | 133 | 192 | 340 |
| 5,000 | 10,301 | 26.0 | 38.0 | 59.0 | 85.0 | 105 | 164 | 237 | 420 |
| 6,000 | 12,574 | 32.0 | 46.0 | 72.0 | 104 | 128 | 200 | 289 | 513 |
| 8,000 | 16,332 | 42.0 | 60.0 | 94.0 | 135 | 167 | 260 | 375 | 667 |
| 10,000 | 20,516 | 52.0 | 75.0 | 118 | 170 | 209 | 327 | 471 | 837 |
| 12,000 | 24,345 | 62.0 | 89.0 | 140 | 201 | 248 | 388 | 559 | 994 |
| 15,000 | 29,572 | 75.0 | 109 | 170 | 244 | 302 | 471 | 679 | 1210 |
| 20,000 | 38,068 | 97.0 | 140 | 219 | 315 | 388 | 607 | 874 | 1550 |
| 25,000 | 45,116 | 115 | 166 | 259 | 373 | 460 | 719 | 1040 | 1840 |
| 30,000 | 54,874 | 140 | 202 | 315 | 454 | 560 | 875 | 1260 | 2240 |
| 40,000 | 71,143 | 181 | 261 | 408 | 588 | 726 | 1130 | 1630 | 2900 |
| 50,000 | 86,432 | 220 | 318 | 496 | 714 | 882 | 1380 | 1980 | 3530 |
| 60,000 | 101,383 | 259 | 372 | 582 | 838 | 1030 | 1620 | 2330 | 4140 |
| 70,000 | 119,062 | 304 | 437 | 683 | 984 | 1210 | 1900 | 2730 | 4860 |
| 80,000 | 132,125 | 337 | 485 | 758 | 1090 | 1350 | 2110 | 3030 | 5390 |
| 90,000 | 149,528 | 381 | 549 | 858 | 1240 | 1530 | 2380 | 3430 | 6100 |
| 100,000 | 175,960 | 449 | 646 | 1010 | 1450 | 1800 | 2810 | 4040 | 7180 |
| 150,000 | 256,357 | 654 | 942 | 1470 | 2120 | 2620 | 4090 | 5890 | 10460 |
| 200,000 | 319,149 | 814 | 1170 | 1830 | 2640 | 3260 | 5090 | 7330 | 13030 |
| 270,000 | 426,459 | 1090 | 1570 | 2450 | 3520 | 4350 | 6800 | 9790 | 17410 |
Table (iii) Energy Absorption of Freighters at ¼ point Berthing (kJ)
| DWT | Assumed
Weight(t) |
Approaching velocity (m/s) | |||||||
| 0.10 | 0.12 | 0.15 | 0.18 | 0.20 | 0.25 | 0.30 | 0.40 | ||
| 700 | 1,585 | 4.0 | 5.8 | 9.1 | 13.0 | 16.0 | 25.0 | 36.0 | 65.0 |
| 1,000 | 2,237 | 5.7 | 8.2 | 13.0 | 18.0 | 23.0 | 36.0 | 51.0 | 91.0 |
| 2,000 | 4,357 | 11.0 | 16.0 | 25.0 | 36.0 | 44.0 | 69.0 | 100 | 178 |
| 3,000 | 6,606 | 17.0 | 24.0 | 38.0 | 55.0 | 67.0 | 105 | 152 | 270 |
| 4,000 | 8,712 | 22.0 | 32.0 | 50.0 | 72.0 | 89.0 | 139 | 200 | 356 |
| 5,000 | 10,795 | 28.0 | 40.0 | 62.0 | 89.0 | 110 | 172 | 248 | 441 |
| 6,000 | 13,515 | 34.0 | 50.0 | 78.0 | 112 | 138 | 215 | 310 | 552 |
| 7,000 | 15,557 | 40.0 | 55.0 | 89.0 | 129 | 159 | 248 | 357 | 635 |
| 8,000 | 17,703 | 45.0 | 65.0 | 102 | 146 | 181 | 282 | 406 | 723 |
| 9,000 | 19,625 | 50.0 | 72.0 | 113 | 162 | 200 | 313 | 451 | 801 |
| 10,000 | 21,630 | 55.0 | 79.0 | 124 | 179 | 221 | 345 | 497 | 883 |
| 12,000 | 26,052 | 66.0 | 96.0 | 150 | 215 | 266 | 415 | 598 | 1060 |
| 15,000 | 31,477 | 80.0 | 116 | 181 | 260 | 321 | 502 | 723 | 1280 |
| 17,000 | 36,784 | 94.0 | 135 | 211 | 304 | 375 | 586 | 845 | 1500 |
| 20,000 | 41,748 | 107 | 153 | 240 | 345 | 426 | 666 | 959 | 1700 |
| 30,000 | 60,483 | 154 | 222 | 347 | 500 | 617 | 964 | 1390 | 2470 |
| 40,000 | 79,393 | 203 | 292 | 456 | 656 | 810 | 1270 | 1820 | 3240 |
| 50,000 | 98,306 | 251 | 361 | 564 | 813 | 1000 | 1570 | 2260 | 4010 |
Table (iv) Energy Absorption of Passenger Ships at ¼ point Berthing (kJ)
| DWT | Assumed
Weight(t) |
Approaching velocity (m/s) | |||||||
| 0.10 | 0.12 | 0.15 | 0.18 | 0.20 | 0.25 | 0.30 | 0.40 | ||
| 500 | 845 | 2.2 | 3.1 | 4.9 | 7.0 | 8.6 | 13.0 | 19.0 | 34.0 |
| 1,000 | 1,709 | 4.3 | 6.2 | 9.8 | 14.0 | 17.0 | 27.0 | 39.0 | 70.0 |
| 2,000 | 3,500 | 8.9 | 13.0 | 20.0 | 29.0 | 36.0 | 56.0 | 80.0 | 143 |
| 3,000 | 5,282 | 13.0 | 19.0 | 30.0 | 44.0 | 54.0 | 84.0 | 121 | 216 |
| 4,000 | 7,105 | 18.0 | 26.0 | 41.0 | 59.0 | 73.0 | 113 | 163 | 290 |
| 5,000 | 8,912 | 23.0 | 33.0 | 51.0 | 74.0 | 91.0 | 142 | 205 | 364 |
| 6,000 | 12,083 | 31.0 | 44.0 | 69.0 | 100 | 123 | 193 | 277 | 493 |
| 7,000 | 13,873 | 35.0 | 51.0 | 80.0 | 115 | 142 | 221 | 319 | 566 |
| 8,000 | 15,346 | 39.0 | 56.0 | 88.0 | 127 | 157 | 245 | 352 | 626 |
| 9,000 | 16,986 | 43.0 | 62.0 | 97.0 | 140 | 173 | 271 | 390 | 693 |
| 10,000 | 18,661 | 48.0 | 69.0 | 107 | 154 | 190 | 298 | 428 | 762 |
| 15,000 | 26,283 | 67.0 | 97.0 | 151 | 217 | 268 | 419 | 603 | 1070 |
| 20,000 | 33,423 | 85.0 | 123 | 192 | 276 | 341 | 533 | 767 | 1360 |
| 30,000 | 47,952 | 122 | 176 | 275 | 396 | 489 | 765 | 1100 | 1960 |
| 50,000 | 71,744 | 183 | 264 | 412 | 593 | 732 | 1140 | 1650 | 2930 |
| 80,000 | 111,956 | 286 | 411 | 643 | 925 | 1140 | 1790 | 2570 | 4570 |
Table (v) Energy Absorption of Barges or Lighters at ¼ point Berthing (kJ)
| G/T | Assuming Weight ( t ) | Approaching velocity ( m/s ) | ||||||
| 0.20 | 0.25 | 0.30 | 0.35 | 0.40 | 0.50 | 0.60 | ||
| 50 | 85 | 0.9 | 1.4 | 2.0 | 2.7 | 3.5 | 5.4 | 7.8 |
| 100 | 161 | 1.6 | 2.6 | 3.7 | 5.0 | 6.6 | 11.0 | 15.0 |
| 150 | 241 | 2.5 | 3.8 | 5.5 | 7.5 | 9.8 | 15.0 | 22.0 |
| 200 | 319 | 3.3 | 5.1 | 7.3 | 10.0 | 13/0 | 20.0 | 29.0 |
| 300 | 496 | 5.1 | 7.9 | 11.0 | 15.0 | 20.0 | 32.0 | 46.0 |
Table (vi) Energy Absorption of Container Ships at ¼ point Berthing (kJ)
| G/T | DWT | Assumed Weight (t) | Approaching velocity ( m/s ) | |||||
| 0.10 | 0.15 | 0.20 | 0.25 | 0.30 | 0.40 | |||
| 8,000 | 12,000 | 26,752 | 68 | 154 | 273 | 427 | 614 | 1090 |
| 9,000 | 14,000 | 33,567 | 86 | 193 | 343 | 535 | 771 | 1370 |
| 16,626 | 16,004 | 38,172 | 97 | 219 | 390 | 609 | 876 | 1560 |
| 21,057 | 20,400 | 48,995 | 125 | 281 | 500 | 781 | 1120 | 2000 |
| 23,600 | 23,650 | 55,560 | 142 | 319 | 567 | 886 | 1280 | 2270 |
| 30,992 | 27,203 | 64,264 | 164 | 369 | 656 | 1020 | 1480 | 2620 |
| 38,826 | 33,287 | 79,599 | 203 | 457 | 812 | 1270 | 1830 | 3250 |
| 41,127 | 27,752 | 67,121 | 171 | 385 | 685 | 1070 | 1540 | 2740 |
| 51,500 | 28,900 | 68,664 | 175 | 394 | 701 | 1090 | 1590 | 2800 |
| 57,000 | 49,700 | 105,199 | 268 | 604 | 1070 | 1680 | 2420 | 4290 |
Table (vii) Energy Absorption of Fishing Vessels at ¼ point Berthing (kJ)
| Type | G/T | Assumed Weight ( t ) | Approaching velocity ( m/s ) | ||||||
| 0.20 | 0.25 | 0.30 | 0.35 | 0.40 | 0.50 | 0.60 | |||
| Whale
factory ship |
10,000
17,000 20,000 |
34,058
53,494 66,217 |
348
546 676 |
543
853 1060 |
782
1230 1520 |
1060
1670 2070 |
1390
2180 2700 |
2170
3410 4220 |
3130
4910 6080 |
| Whale ship | 400
800 1,000 |
1,797
3,263 3,950 |
18.0
33.0 40.0 |
29.0
52.0 63.0 |
41.0
75.0 91.0 |
56.0
102 123 |
73.0
133 161 |
115
208 252 |
165
300 363 |
| Trawler
Vessel |
400
800 1,000 2,000 3,000 |
2,297
3,693 4,458 7,173 9,863 |
23.0
38.0 45.0 73.0 101 |
37.0
59.0 71.0 114 157 |
53.0
85.0 102 165 226 |
72.0
115 139 224 308 |
94.0
151 182 293 403 |
146
236 284 457 629 |
211
339 409 659 906 |
| Skipjack
vessel |
20
50 100 200 |
126
202 390 779 |
1.3
2.1 4.0 7.9 |
2.0
3.2 6.2 12.0 |
2.9
4.6 9.0 18.0 |
3.9
6.3 12.0 24.0 |
5.1
8.2 16.0 32.0 |
8.0
12.9 25.0 50.0 |
12.0
19.0 36.0 72.0 |
| Mackerel
vessel |
20
50 100 |
112
266 525 |
1.1
2.7 5.4 |
1.8
4.2 8.4 |
2.6
6.1 12.0 |
3.5
8.3 16.0 |
4.6
11.0 21.0 |
7.1
17.0 33.0 |
10.0
24.0 48.0 |
| Tuna
long-liner |
150
200 400 |
590
780 1,681 |
6.0
8.0 17.0 |
9.4
12.0 27.0 |
14.0
18.0 39.0 |
18.0
24.0 53.0 |
24.0
32.0 69.0 |
38.0
50.0 107 |
54.0
72.0 154 |
| Round
Haul netter |
20
50 100 |
75
191 377 |
0.8
1.9 3.8 |
1.1
3.0 6.0 |
1.7
4.4 8.7 |
2.3
6.0 12.0 |
3.1
7.8 15.0 |
4.8
12.0 24.0 |
6.9
18.0 35.0 |
| Towing
net vessel |
20
50 100 300 500 |
99
204 361 1,138 1,838 |
1.0
2.1 3.7 12.0 19.0 |
1.6
3.3 5.8 18.0 29.0 |
2.3
4.7 8.3 26.0 42.0 |
3.1
6.4 11.0 36.0 57.0 |
4.0
8.3 15.0 46.0 75.0 |
6.3
13.0 23.0 73.0 117 |
9.1
19.0 33.0 105 169 |
| General
fishing vessel |
20
50 100 150 |
77
195 350 500 |
0.8
2.0 3.6 5.1 |
1.2
3.1 5.6 8.0 |
1.8
4.5 8.0 11.0 |
2.4
6.1 11.0 16.0 |
3.1
8.0 14.0 20.0 |
4.9
12.0 22.0 32.0 |
7.1
18.0 32.0 46.0 |
Table (viii) Energy Absorption of Ferry Boats at ¼ point Berthing (KJ)
| G/T | Assumed Weight (t) | Approaching velocity ( m/s ) | ||||||
| 0.20 | 0.25 | 0.30 | 0.35 | 0.40 | 0.50 | 0.60 | ||
| 50 | 124 | 1.3 | 2.0 | 2.8 | 3.8 | 5.1 | 7.9 | 11.0 |
| 100 | 246 | 2.5 | 3.9 | 5.6 | 7.7 | 10.0 | 16.0 | 23.0 |
| 200 | 430 | 4.4 | 6.9 | 9.9 | 13.0 | 18.0 | 27.0 | 39.0 |
| 300 | 664 | 6.8 | 11.0 | 15.0 | 21.0 | 27.0 | 42.0 | 61.0 |
| 500 | 1,012 | 10.0 | 16.0 | 23.0 | 32.0 | 41.0 | 65.0 | 93.0 |
| 1,000 | 1,796 | 18.0 | 29.0 | 41.0 | 56.0 | 73.0 | 115 | 165 |
After having the effective berthing energy value, one can then choose the suitable type of marine fender design / system. Performance has to be compared in order to design the most suitable system. For example, deflection curve, energy absorption and reaction of a cylindrical fender is different from an arch-shaped fender. One has to compare alternatives and then determine which one is more suitable for use. This is when previous records of fender systems deployed play a big role in advising the suitability for the particular marine condition.
Energy Absorption:
The obvious factor in designing a fender system. This value has to be higher than the effective impacting energy of ships.
Reaction Force:
This value has to be less than the vessel’s allowable reaction force to prevent damage to the hull surface (or in extreme cases, the structure as a whole).
Environmental Condition:
It is vital to determine how harsh the working conditions for the fenders will be. One will have to choose accordingly its durability to handle strong waves, winds, or extreme weather. If the working condition is very demanding, it is possible you will have to replace the fenders quite often.
Berthing Angle:
A fender that can accept a situation’s angular compression has to be considered. An angular compression does not result in a simplistic linear energy absorption curve so this has to be a main priority when choosing a rubber fender design.
Fender (or Panel) Surface Pressure
Surface pressure value of fender has to be less than the vessel’s allowable hull surface pressure. For certain fenders like super cell type and cone type, they most commonly come with frontal frames/panels that distributes the pressure. So to decrease surface pressure value, one can increase the surface area of the panel.
Trustworthy Supplier
Choose a quality rubber fender manufacturer. Some people always assume that prices and quality can not come together but it is possible in today’s manufacturing innovation and high tech automation processes. Manufacturers are spending less time doing low importance repetitive work and focusing on Quality Control (QC) processes assisted by great process flow.

Fender Arrangement and Spacing In Between
After choosing what type and size of fenders to use, the next step is determining the number of fenders. To do that, one has to take into consideration fender spacing. The spacing between fenders play a very important role in determining a fender system’s success. Should one opt to save cost and have too great a spacing between fenders, accidents might happen where vessel berthing might hit the dock structure. British Standards recommend that for a continuous quay, the installation pitch is recommended to be less than 15% of the vessel.
The maximum spacing between fenders (S) can be calculated with this equation:
Maximum Spacing between Fenders, 
Note:
RB = Bow Radius of Board Side of Vessel (m, ft).
If radius info is not available, one can use this estimation to find out the info:

PU = Uncompressed Height of Fender incl. Panel (m, ft)
C = Fender Height in Rated Compression.
![]() = Fender Deflection (m, ft)
= Fender Deflection (m, ft)
For arrangement consideration especially distance between fenders, it is important to keep in mind that one should not only have the largest vessel type in mind. As smaller vessel might face problems berthing if one only design for large vessels.
This shows an improper design as smaller vessels berthing at the dock would crash into the wall:

This might be a possible solution for this situation:

Of course, aside from fender spacing, all aspects from angular compression energy absorption to hull pressure per unit needs to be considered as well. If a particular type does not satisfy requirement, one should consider other options.
Choosing a Suitable Frontal Panel
To choose a suitable panel, one has to consider hull pressures allowed for the berthing vessels. The following table shows a rough guide of allowable hull pressures of certain popular type of vessels. (just for reference):
|
Allowable Hull Pressures |
|
| Vessel Type | Hull Pressure KN/m2 |
| Tankers | 150~250 |
| ULCC & VLCC(Coastal Tankers) | 250~350 |
| Product & Chemical Tankers | 300~400 |
| Bulk Carriers | 150~250 |
| Post-Panamax Container Ships | 200~300 |
| Panamax Container Ships | 300~400 |
| Sub-Panamax Container Ships | 400~500 |
| General Cargo | 300~600 |
| Gas Carriers | 100~200 |
Calculation:

P: Hull Pressure(N/m2, psi)
ΣR: Combined Reaction Forces of all rubber fenders
A1: Valid Panel Width excluding lead-in chamfers(m)
B1: Valid Panel Height excluding lead-in chamfers(m)
PP: Permissible hull pressure(N/m2, psi)
Another option: WITHOUT frontal frames.
Rubber fenders like arch fenders and cylindrical fenders do not come with frontal frames. The fender body itself comes into contact with the vessel’s hull during berthing. One has to carefully consider the hull pressure exerted.
Selecting the Chains
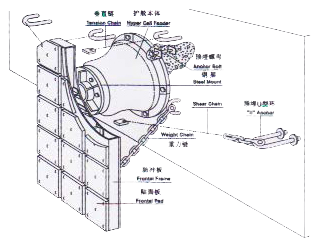
A common fender system with frontal frame usually involve a Weight Chain, Tension Chain and Shear Chain.
| Chain | Function | |
|---|---|---|
| Weight Chain | Normally installed at a static angle of 15 – 25° to the vertical, its main function is to sustain the weight of the entire frame panel structure | |
| Tension Chain | Protect the fender against damage when compressed | |
| Shear Chain | Fixed at 20 – 30° to the horizontal, shear chain exists to avoid damage while the fender is in shear deformation |
Some installation do not involve shear chain, but a fender system would definitely be more resistant to shear damage with them.


h1: Static offset between brackets(m, ft)
Ф2: Dynamic Angle of Chain(°)
h2: Dynamic offset between brackets at F(m, ft)
D: Fender compression(m, ft)
R: Reaction Force of rubber units behind the frontal panel(N, Lbs)
W: Weight of the panel face(N, Lbs)
FL: Safe working Load of chain(N, Lbs)
L: Bearing length of chain(m, ft)
n: number of chains acting together
μ: Friction coefficient of face pad. Usually equals 0.15 for UHMW-PE facings.
FM: Minimum Breaking Load(N, Lbs)
FS: Safety Factor(2~3 times)
Tips on choosing suitable chains:
- Chain sizes should be as exact as possible. An overly tight chain or an overly loose chain would fail the system.
- Safety factor has to be considered. At least 2 to 3 times of the work load.
- Open link type is more preferable.
Installation tips:
- One must consider installation during the early design process and not after choosing the fenders and finalising the purchase as the maintenance, wear allowances and protective nets/coatings will affect their useful life.
- Chains should not be installed twisted. They might break due to a reduction in load capacity.
A small tip after preliminary choosing the type of fenders to use, make sure you do not make these 5 top mistakes that causes structural failures for marine fenders.